SPY Levels & Game Plan
Wednesday, April 22, 2026
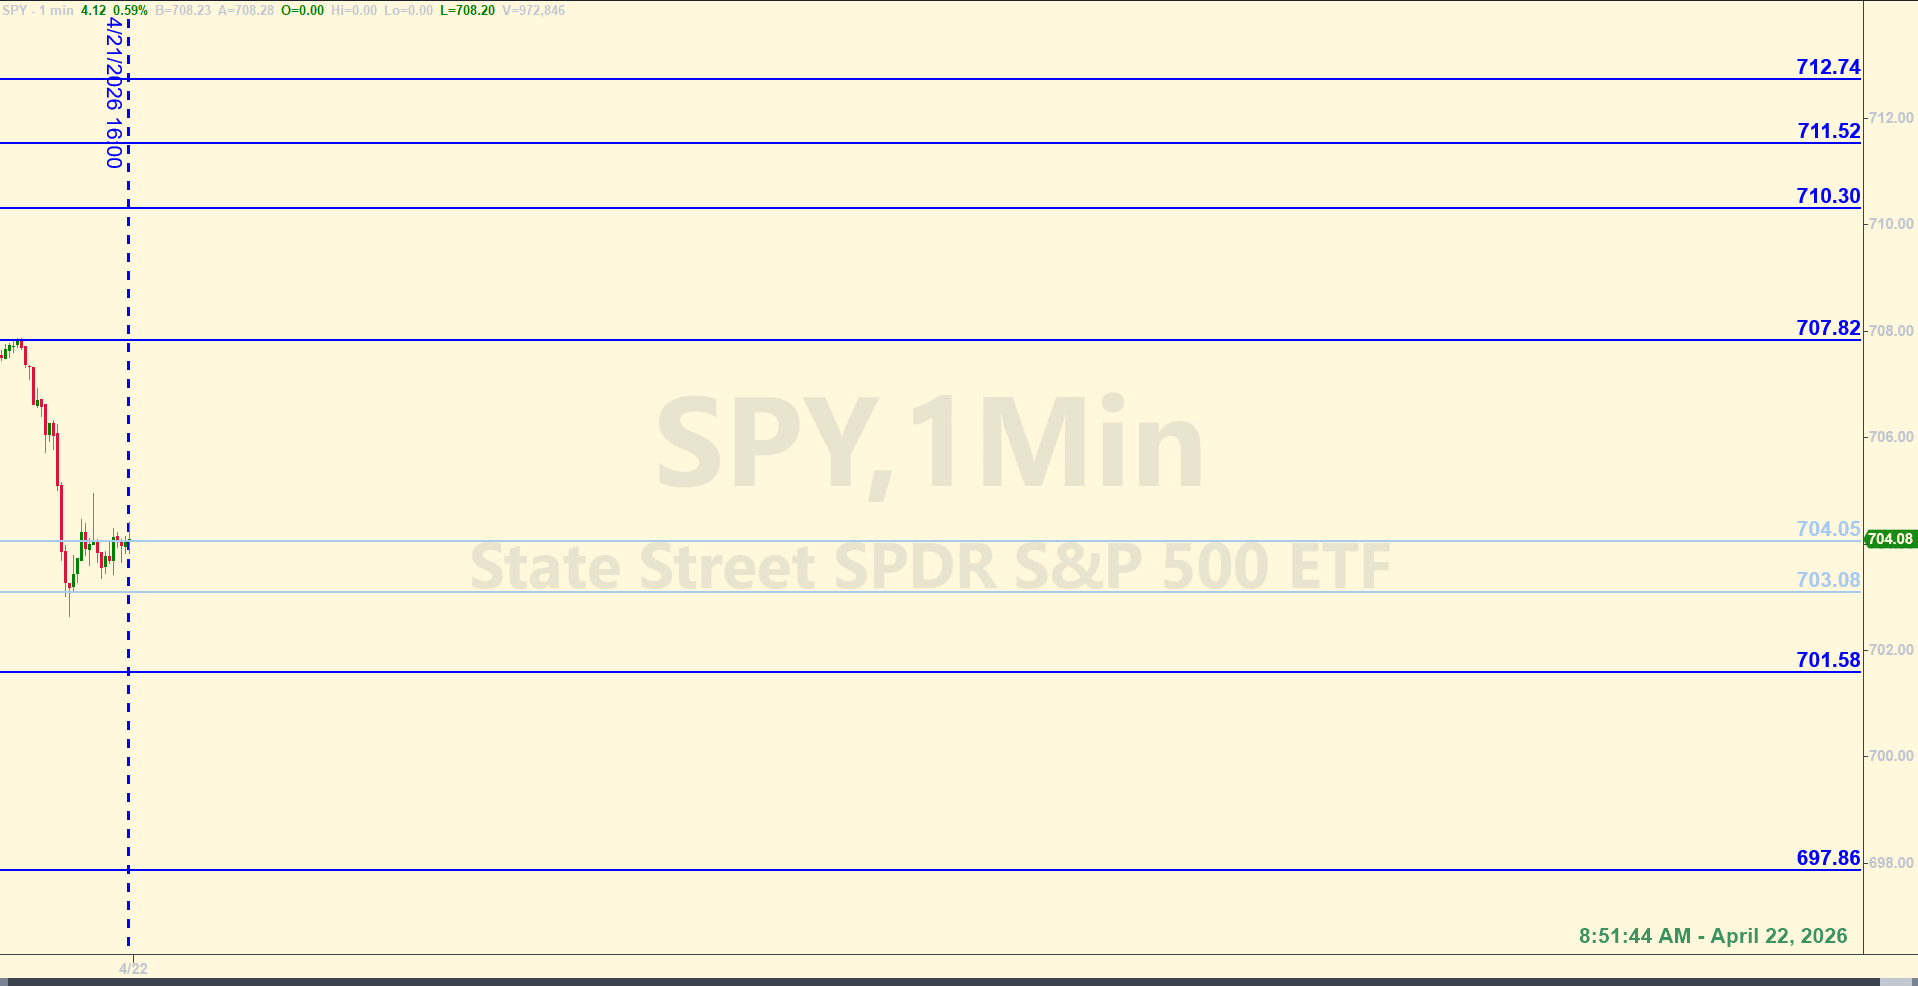
8:51 am Eastern - Remember the axis level from yesterday at 709.68? If price got under and started closing hourly candles under it, the bears would have been in a better position to pull price down more. That did happen yesterday. Now this morning in the premarket, price is back up to that same axis level of 709.68. They're knocking on the door trying to get on top of it. It's not an official level for today, but it could come in handy later. So keep it in mind.
The axis area for today is lower - down at 704.05 to 703.08. If price can say above this area, then they're in a better position to keep grinding higher. There's a relatively large number of points between current price and 704.05, but it is what it is. The market is extended and wide moves are possible. Getting below and closing hourly candle below today's axis area puts the ball back in the bears court - at least for today.
Other things to pay attention to are the DJT and the IWM. The transports are still on a rip, but they ran into resistance yesterday - as predicted. By the end of the day yesterday, they were back up to new all-time highs, but they put in a doji candle on the 4-hour chart in the meantime. They need to get a 4-hour candle close (or two or more) above 24,232 for a short against yesterday's high to be off the table. But for the near term, at least, the DJT put in a signal that they might pull back more today. And if they do, SPY is likely to fall too.
The bullish momentum is still strong across most markets so there is no guarantee that we'll see a pause in bullish activity, or a rest or reset. But as we've said a few times already, markets don't go in a straight line forever. There will be a more substantial pullback eventually. And keeping an eye on the transports is a good idea. Maybe we'll have a Wacky Wednesday again. The middle of the week is often when the market decides to do something interesting. Giver the levels more wiggle room today, and as always, be aware of what's going on with the longer timeframes instead of looking only at the 1-minute chart.
No data releases scheduled for today. Trade well!After the closing bell...
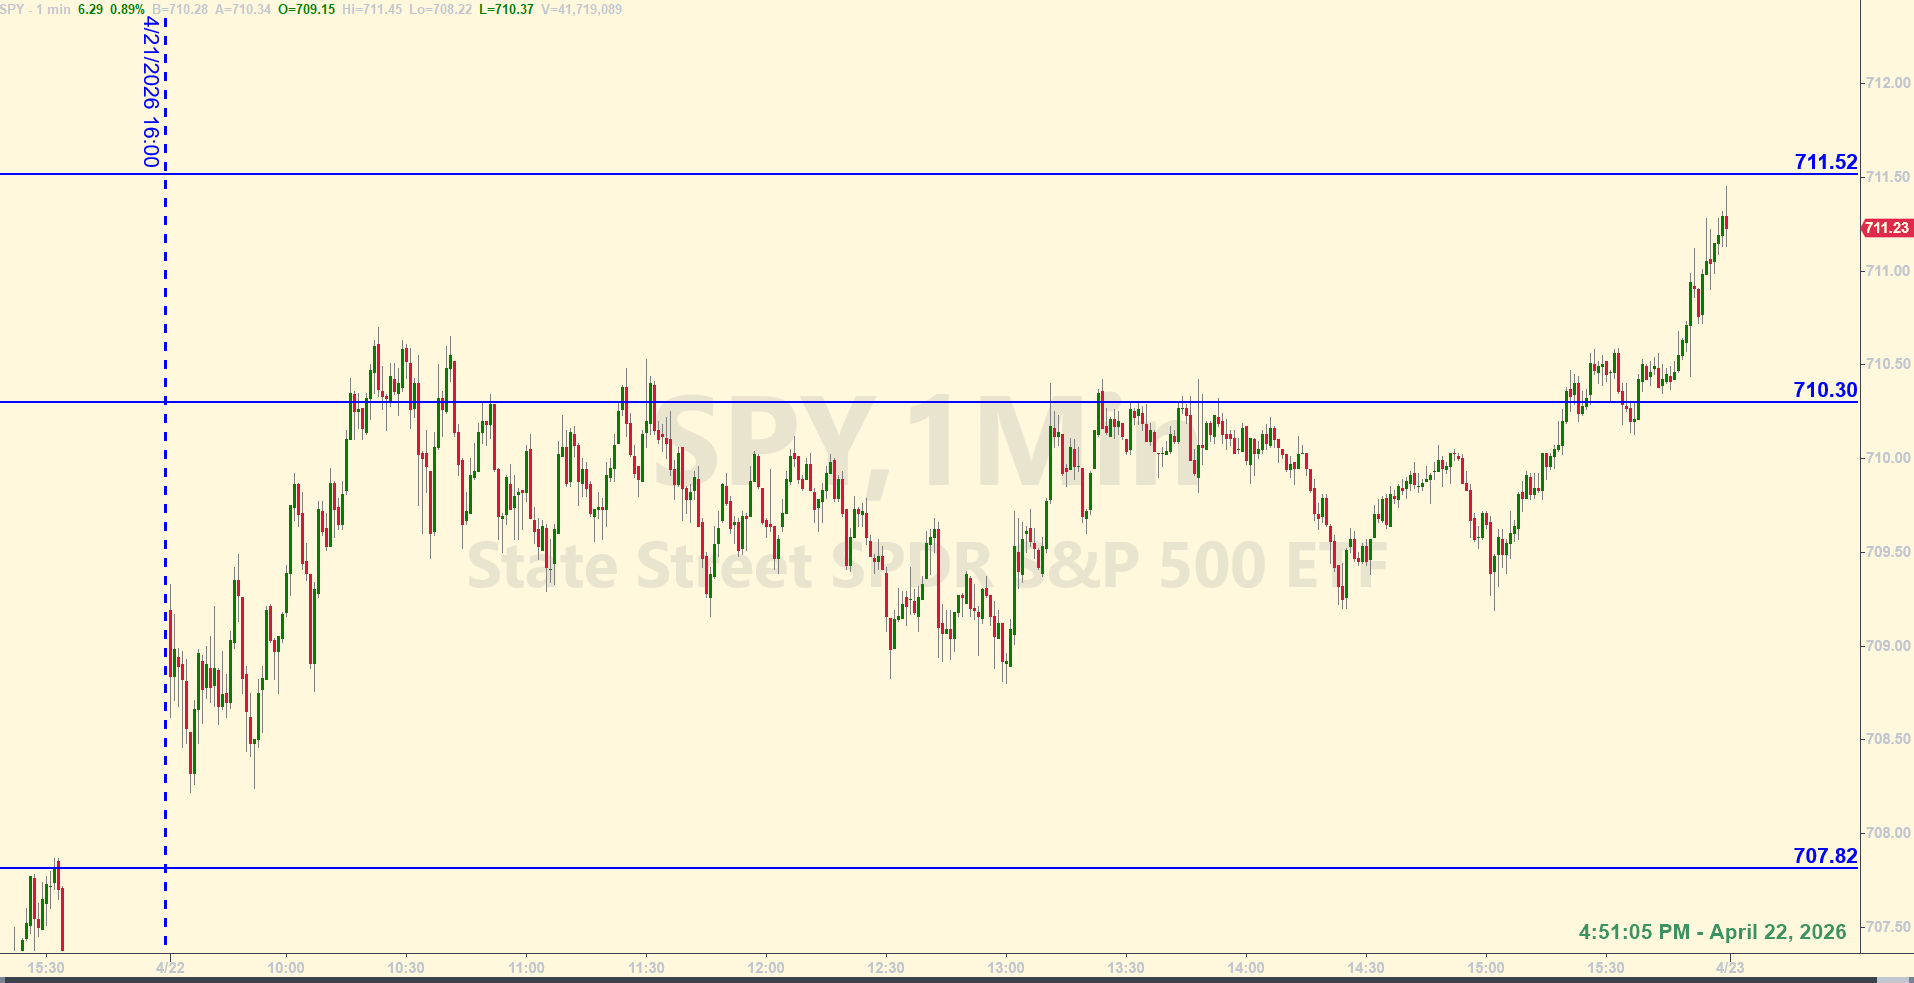
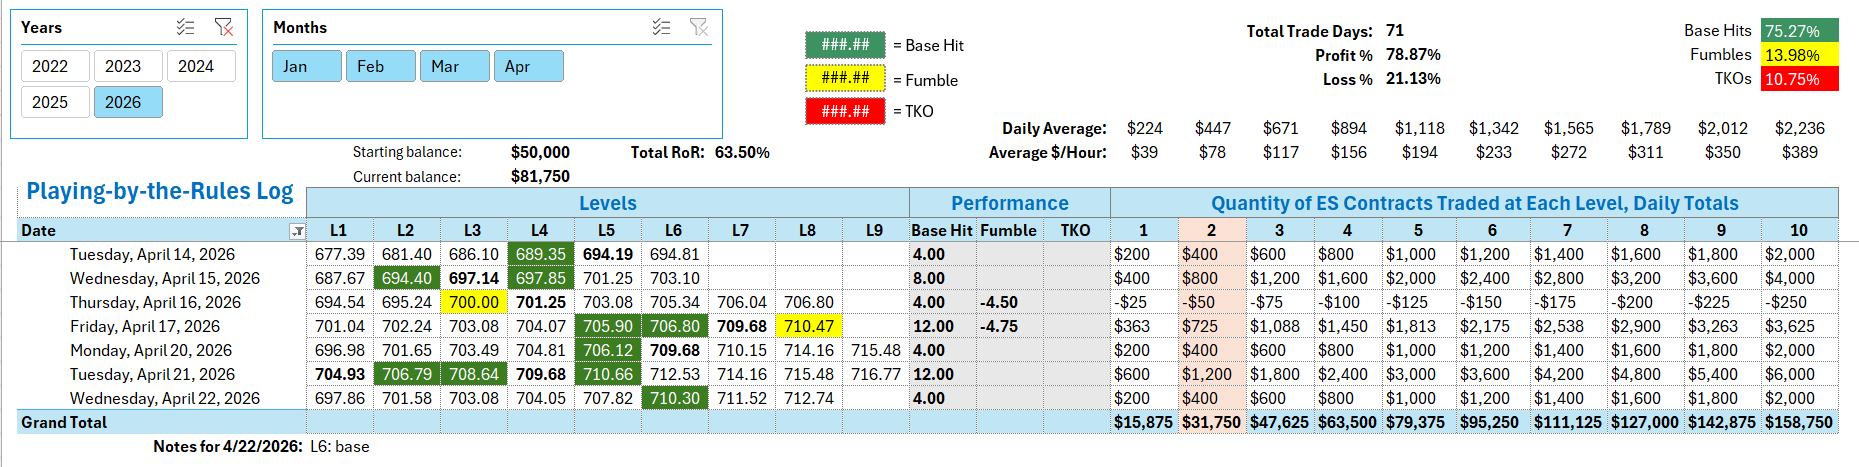
See notes at the bottom of the Tracking Log below to see how the levels worked for today. The data you see in the Log below represents all of 2026 to-date. The rate of return and other metrics assume a starting balance of $50,000 on January 2, 2026, and two (2) ES contracts traded at each level each day, following all the rules of the Ticks & Trades strategy.
Click anywhere on the Log to enlarge the image.
Tracking log to-date for 2026: