SPY Levels & Game Plan
Monday, April 20, 2026
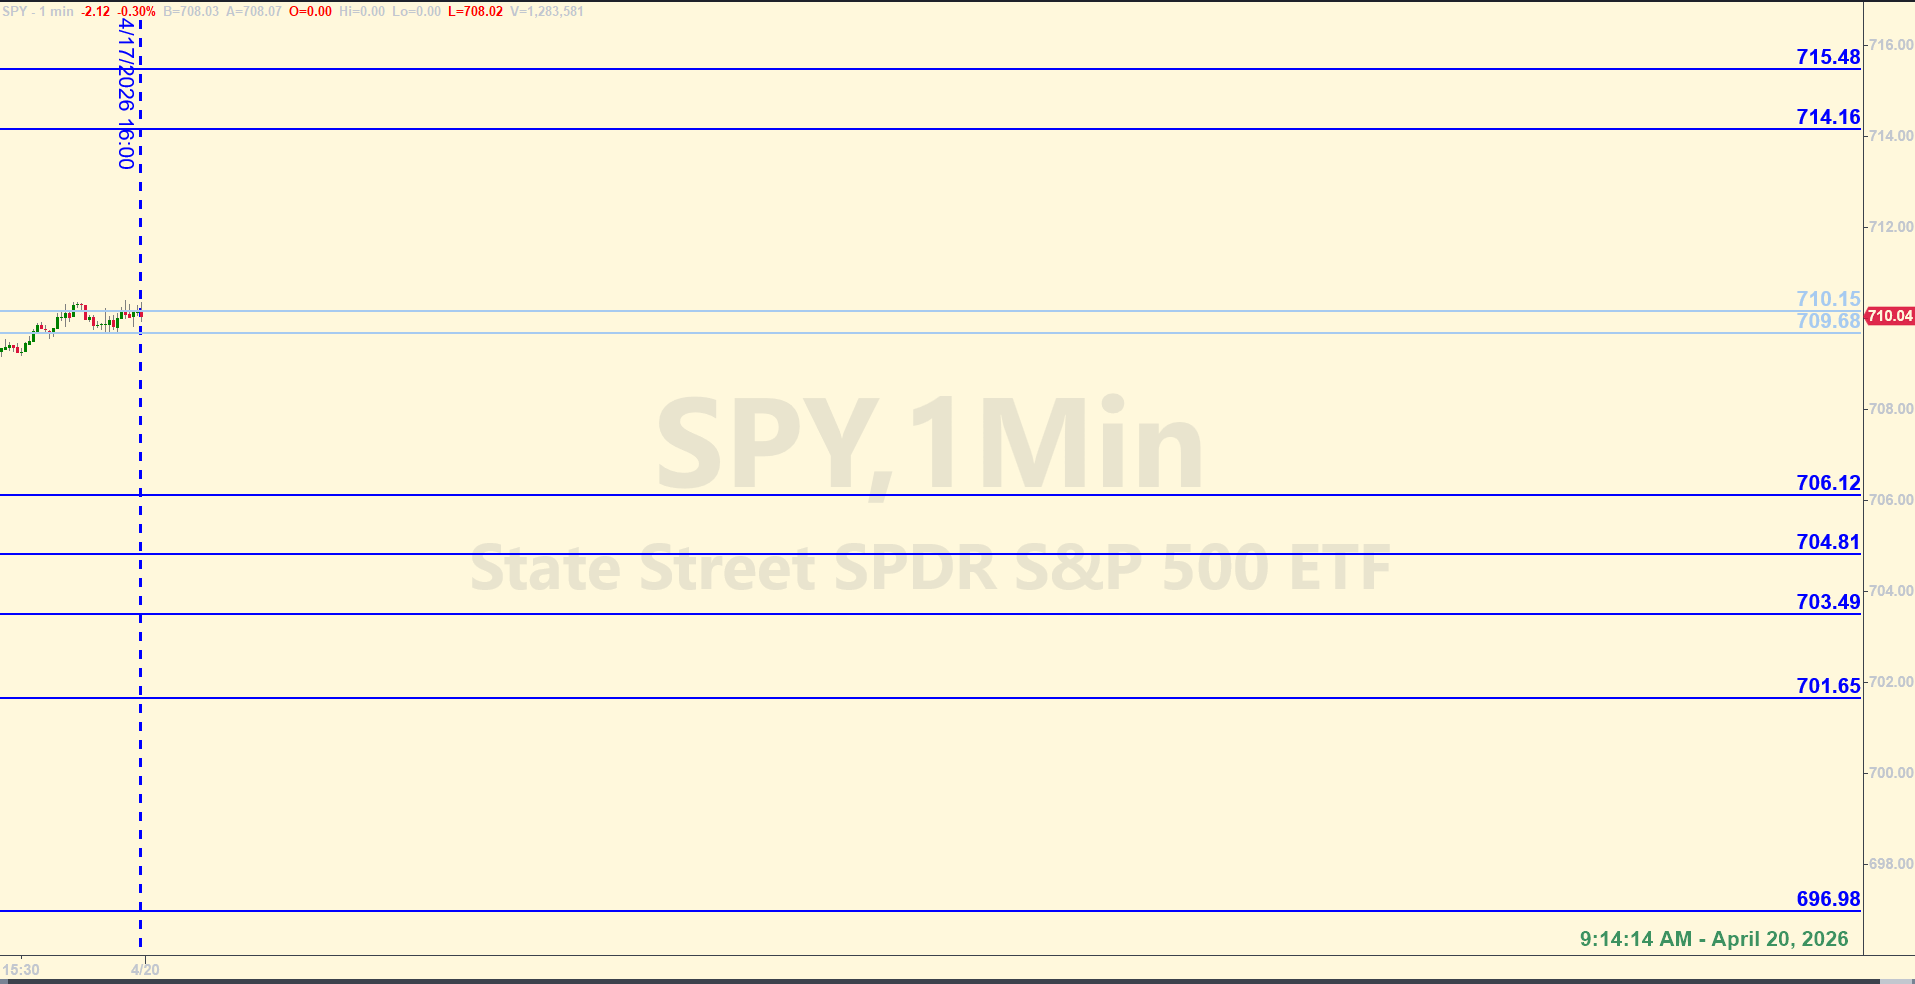
9:14 am Eastern - We've got a little pullback in the premarket this morning. Price already visited some leftover levels from last Friday and bounced from there. For today, we have an area between 709.68 and 710.15 that could be an axis area. If the bulls can get price up there and start closing hourly candles above 710.15, then it would be more likely for more bullish market behavior to stick around. But right now, price is below that area. If the SPY continues to stay below that area, the bears could get some more selling going on, which could pull price down some more. We have other levels of typical support and resistance above and below current price. As always, it's good to know what's going on over on the longer timeframes in real time before trading against the levels in the E-minis.
The DJT may pull back today. That remains to be seen. But the IWM is already in a premarket pullback like the SPY. All these markets can start to influence each other. The DJT is the strongest, with the biggest surges lately, and therefore it's possible they could have a more drastic correction - if increased selling starts to happen over there. Not saying it will, but they are "over-extended". Remember what happened when 20,000 was hit for the first time? We got the multi-week pull back, and the SPY followed the DJT. So we need to keep an eye on the transports.
I personally would probably use the 709.68 to 710.15 area more as a gauge. Not sure I'd trade the precise levels unless I saw other compelling reasons there could be more overhead resistance up there - if price does climb up there today. No data releases scheduled for today. Pay attention to your surroundings and trade well today.
After the closing bell...
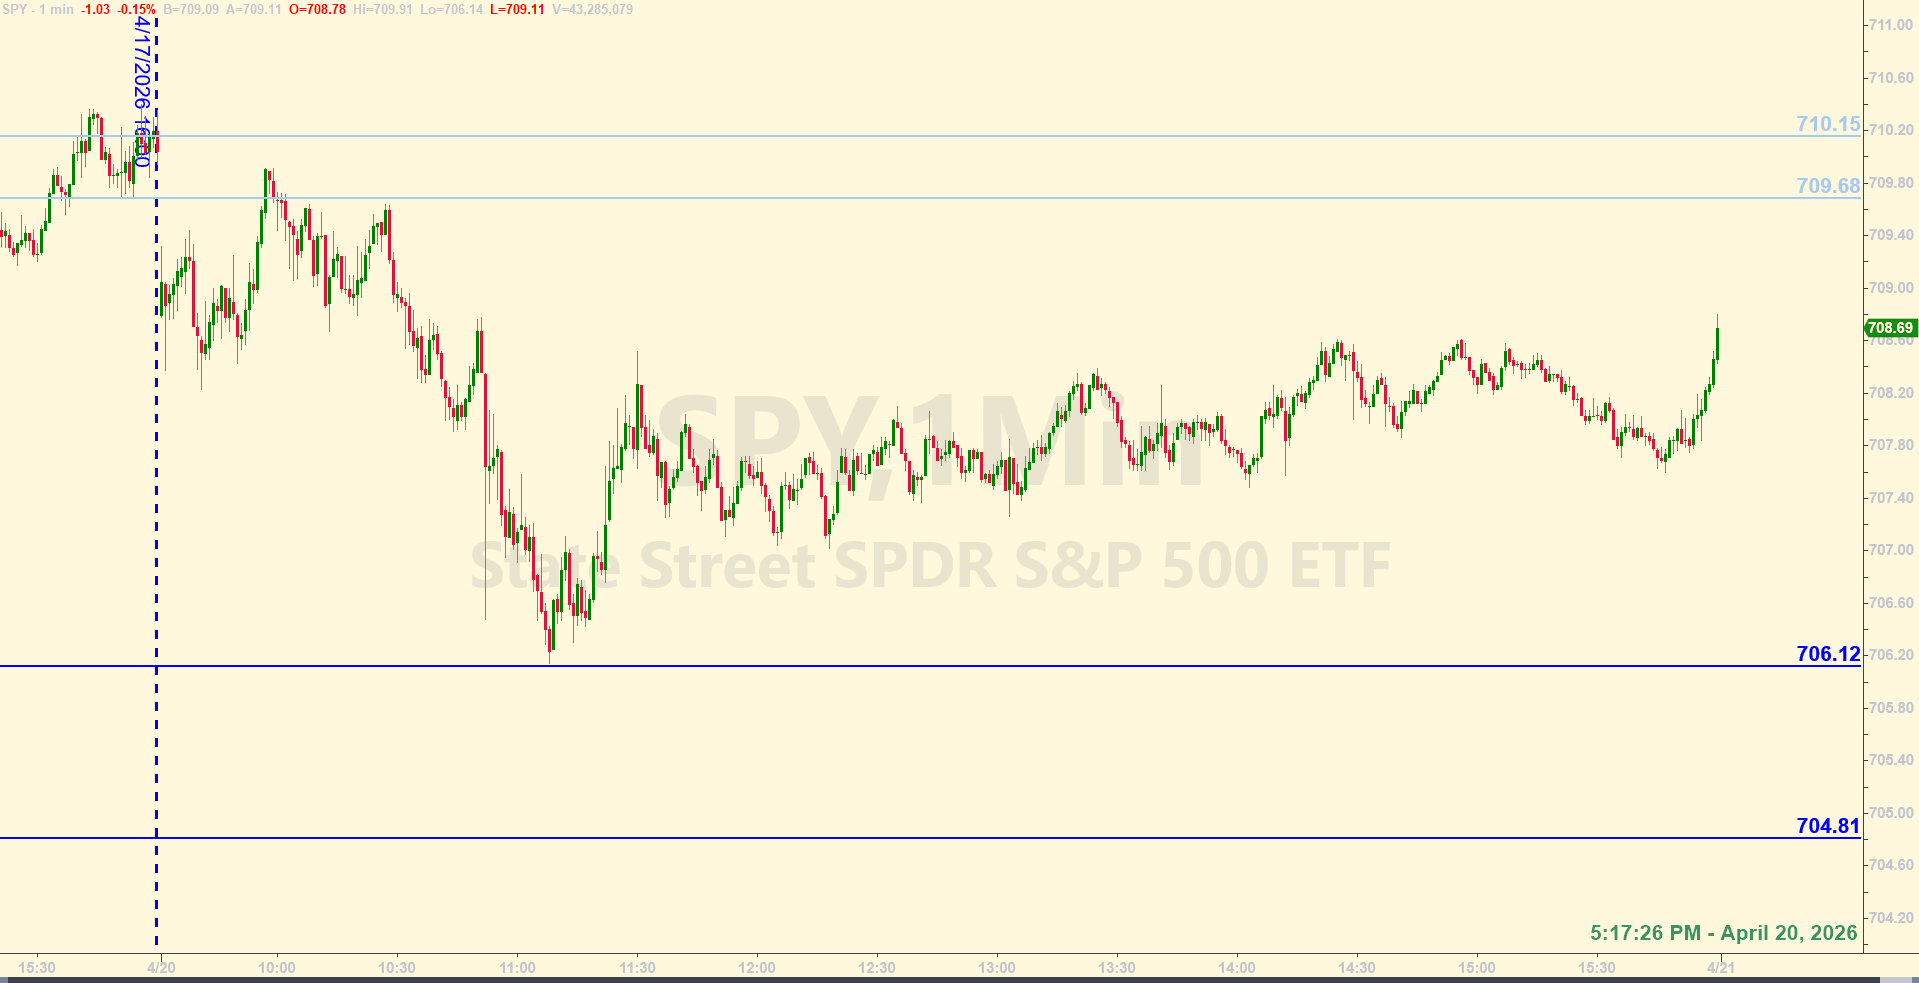
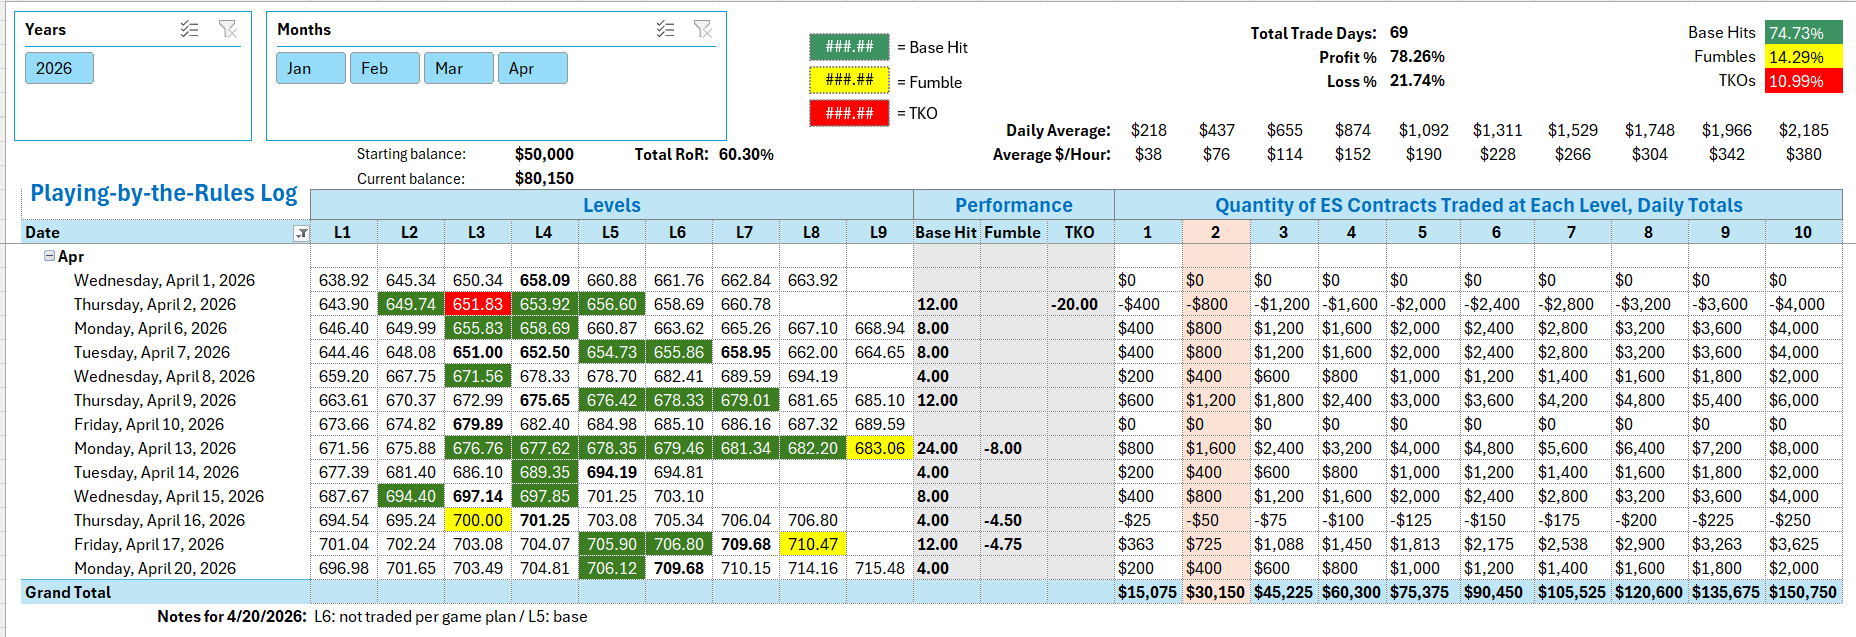
See notes at the bottom of the Tracking Log below to see how the levels worked for today. The data you see in the Log below represents all of 2026 to-date. The rate of return and other metrics assume a starting balance of $50,000 on January 2, 2026, and two (2) ES contracts traded at each level each day, following all the rules of the Ticks & Trades strategy.
Click anywhere on the Log to enlarge the image.
Tracking log to-date for 2026: