SPY Levels & Game Plan
Wednesday, April 22, 2026
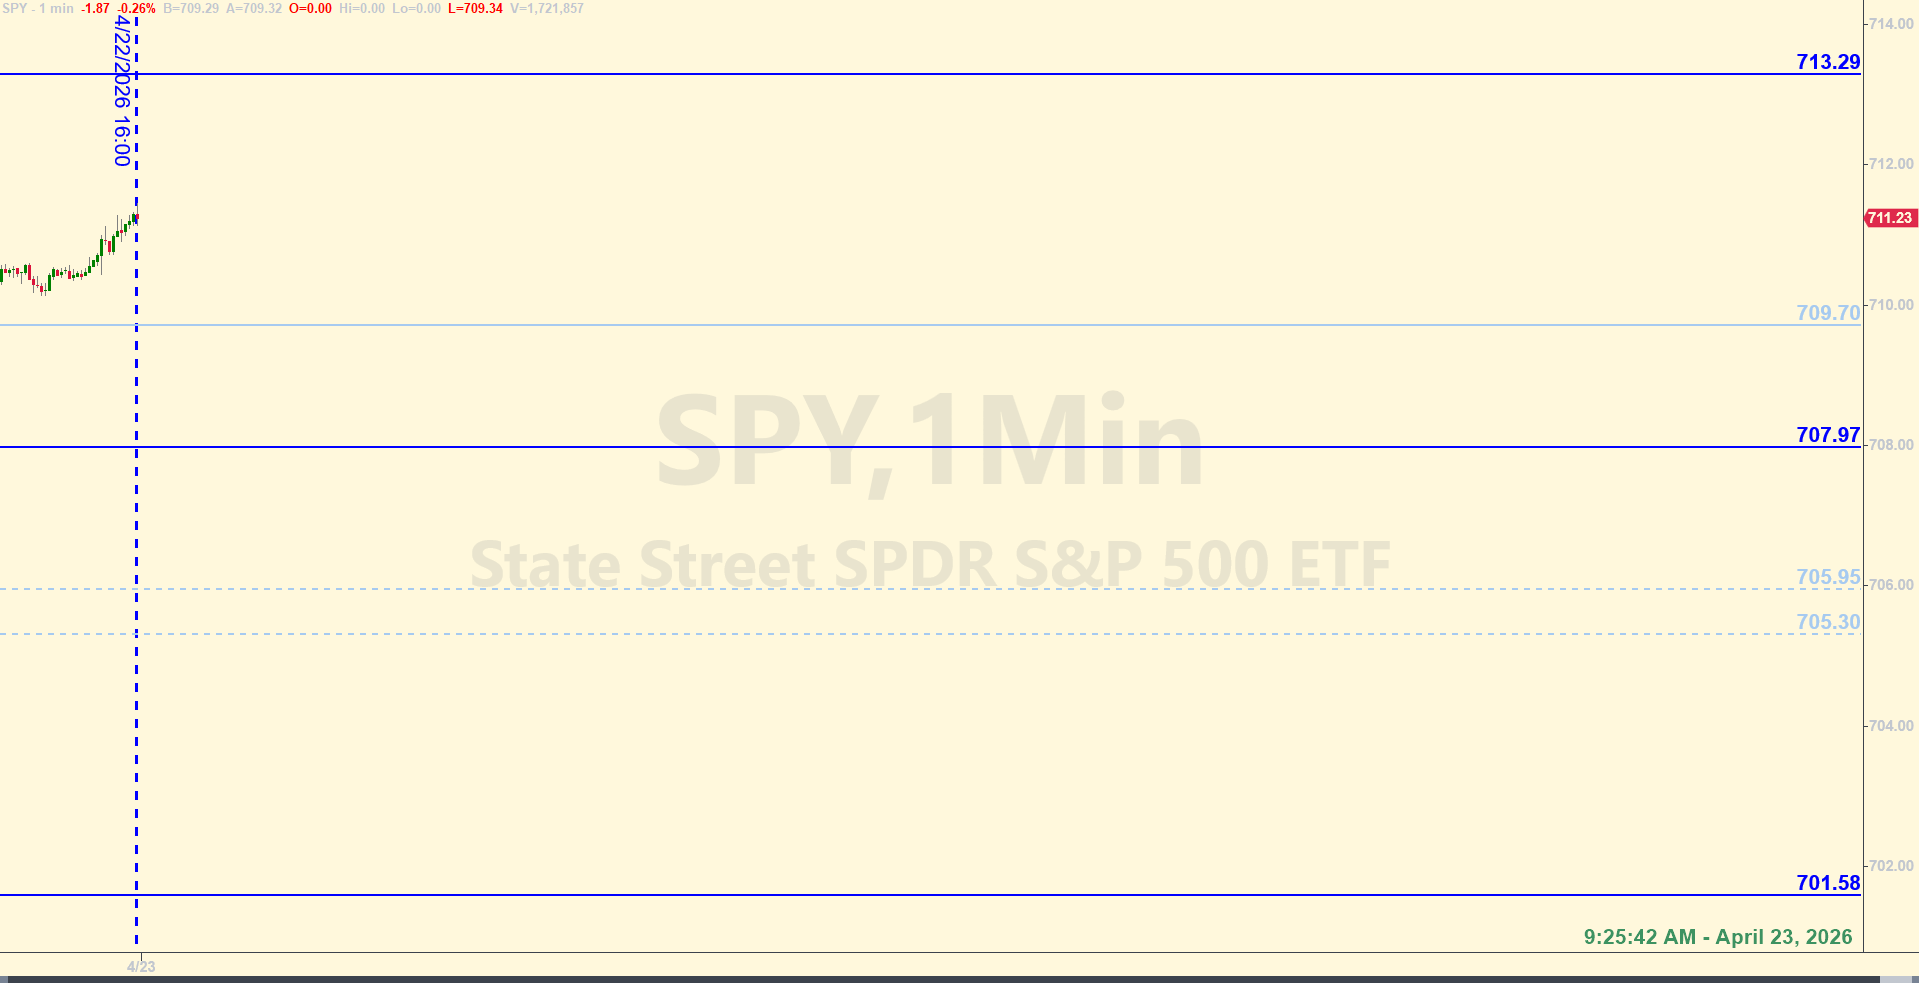
9:25 am Eastern - The axis level from the last couple days continues to be important. Today, that level is at 709.70. Price stayed mostly above it yesterday, but they're back down to that area in this morning's premarket session. Once again, we're using it as an axis level - above is better for the bulls. But we have other things to contend with for today too. The DJT (the transports) had a major down day yesterday. We said it was possible - the signals were there. So while they have dropped a lot, they were already "over-extended" before the drop. This means it's entirely possible for them to come back down to 20,000 before they find support. With what happened yesterday in DJT, the odds are increased that we'll have a down day today in SPY. Price is flirting with that axis level (which is just a gauge for today - not a tradable level by default), and if the bears can start selling some more, then it will put the bulls on notice. They'll need to defend the zone down at 705.95 to 705.30. If they let price get under that bear axis zone, price has the potential to fall more. Currently SPY is choppy.
The bear axis zone is an area where there could be support if the bulls can defend it. But I wouldn't necessarily trade against those precise levels. I'm looking at the whole area as a zone. Price could spike below it a little and find some support, or they could come up short and bounce. So to trade against that area means understanding that it could take some time. Hourly closes below that whole zone is better for the bears.
We need to keep an eye on how the DJT handles what happened yesterday. Will there be a big rally back up to a retracement level before price continues down? That could take a day or two. Or will there be follow through to the downside today? Either way, increased volatility in the transports may have an effect on the larger market, if the SPY feels some of those reverberations.
There are PMI data releases at 9:45 am. Stay alert and trade well today.After the closing bell...
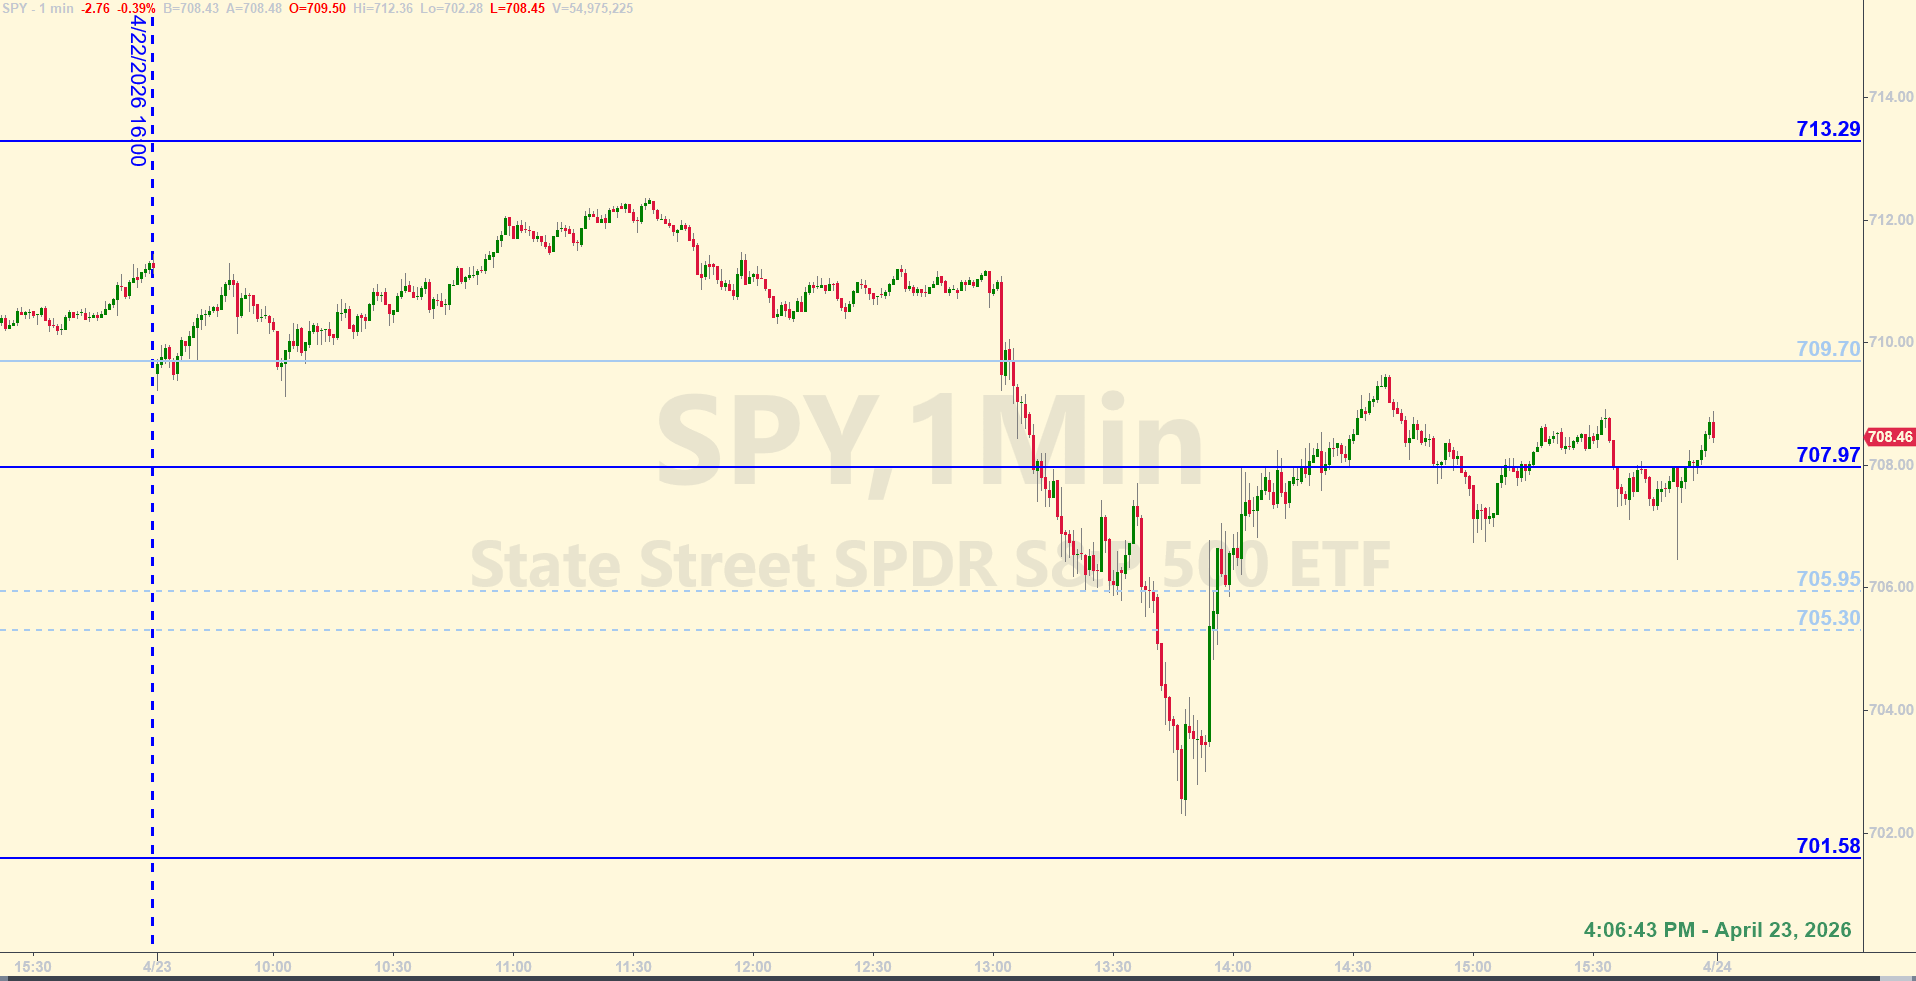
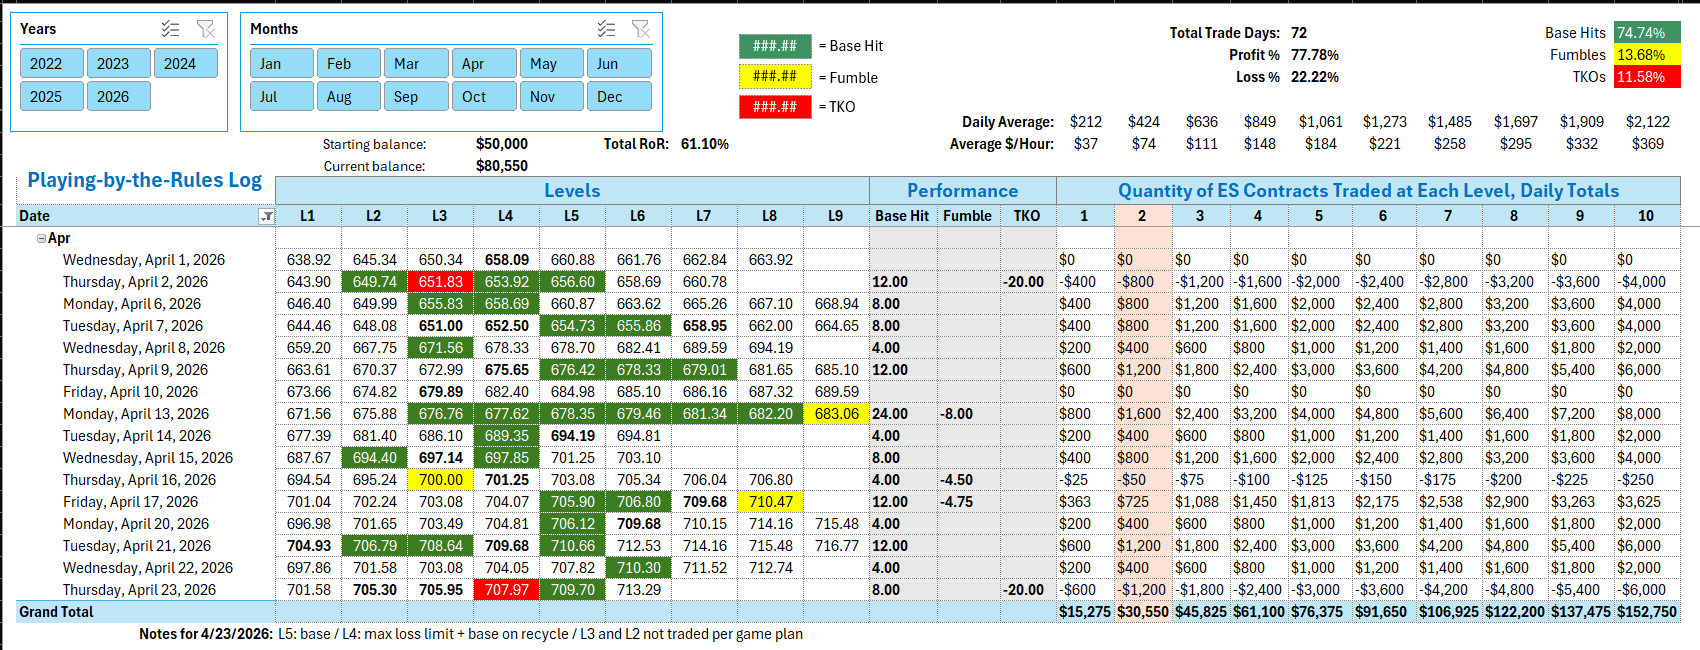
See notes at the bottom of the Tracking Log below to see how the levels worked for today. The data you see in the Log below represents all of 2026 to-date. The rate of return and other metrics assume a starting balance of $50,000 on January 2, 2026, and two (2) ES contracts traded at each level each day, following all the rules of the Ticks & Trades strategy.
Click anywhere on the Log to enlarge the image.
Tracking log to-date for 2026: