SPY Levels & Game Plan
Wednesday, April 29, 2026
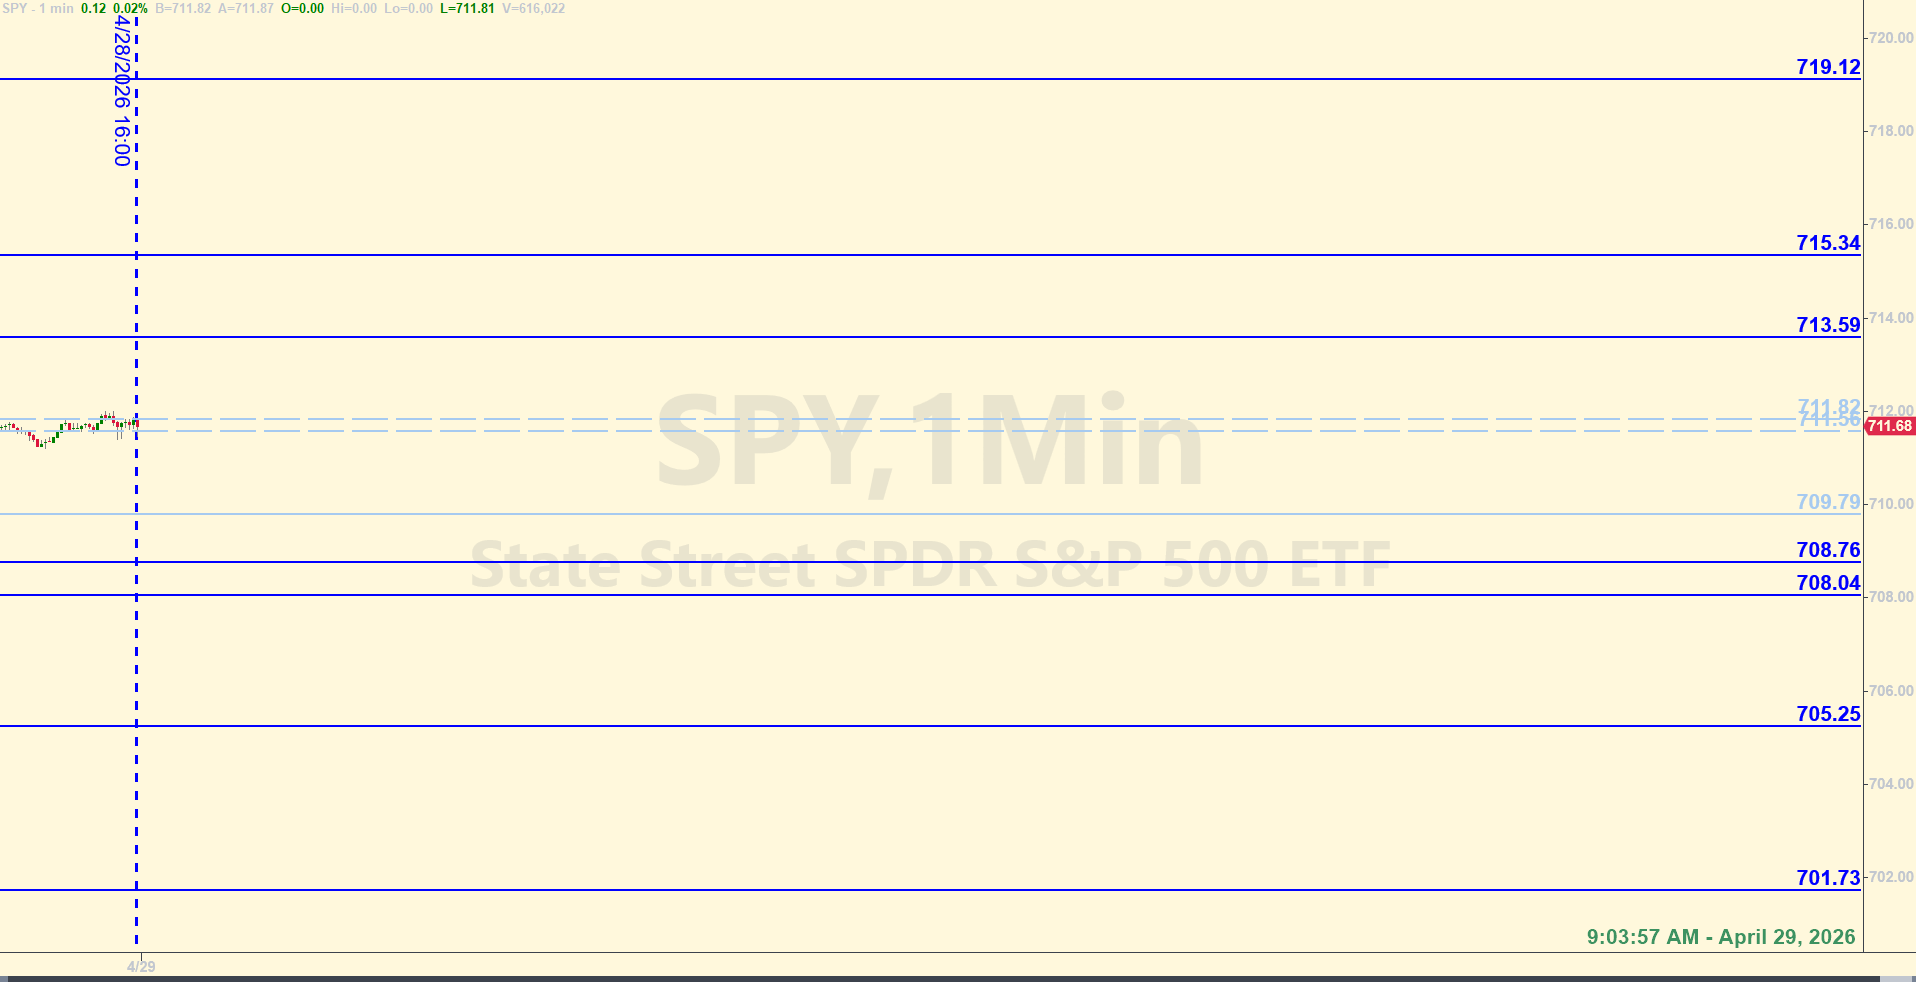
9:03 am Eastern - The bulls were able to keep price on top of the axis level of 709.68 all day yesterday. It proved to be good support during the regular session and the overnight session through the morning, so far. For today, that axis level is adjusted slightly, to 709.79. It's the main axis level where if price stays above, it's better for the bull case, and if price gets below and starts closing hourly candles below, it's better for the bear case.
Above that axis level is a small zone between 711.56 to 711.82. That's where price has been hanging out all night and into the premarket session. The whole area is important, but I wouldn't necessarily trade each of the individual levels of that zone. If price comes into that area the right way and at the right time, I could see picking whichever level offers the best price and trade against one of them. But the whole area is also like a gauge for future potential price action - whether bullish or bearish. There are areas of overhead resistance above it, so the whole zone isn't like a long term zone - just for today.
Also, at 2:00 PM Eastern we have the FOMC announcement. Leading up to that could be quiet or things could get volatile. Trading before 1:00 pm is trader's choice. But a best practice is to not plan on getting into any new trade after 1:00 pm. By 2:00 pm and later, price could get whippy.
There is still room on the downside for SPY to correct. Either they continue to go sideways for awhile - as in, for several more days - or a catalyst of some sort sends price in the downward direction to where the SPY catches up with the drastic trend trend change kind of action we saw over in the DJT. There isn't really a correlation, but often big moves in the DJT proceed a big move in the SPY. Just something to be aware of. Price in SPY could pull down to 700 or below quickly, and it wouldn't be out of the ordinary. With the Fed announcement happening today, the odds of increased volatility is increased. Base Hit trades are the plan - up to 1:00 pm. Then, it's better to step away and be an observer. Trade well!After the closing bell...
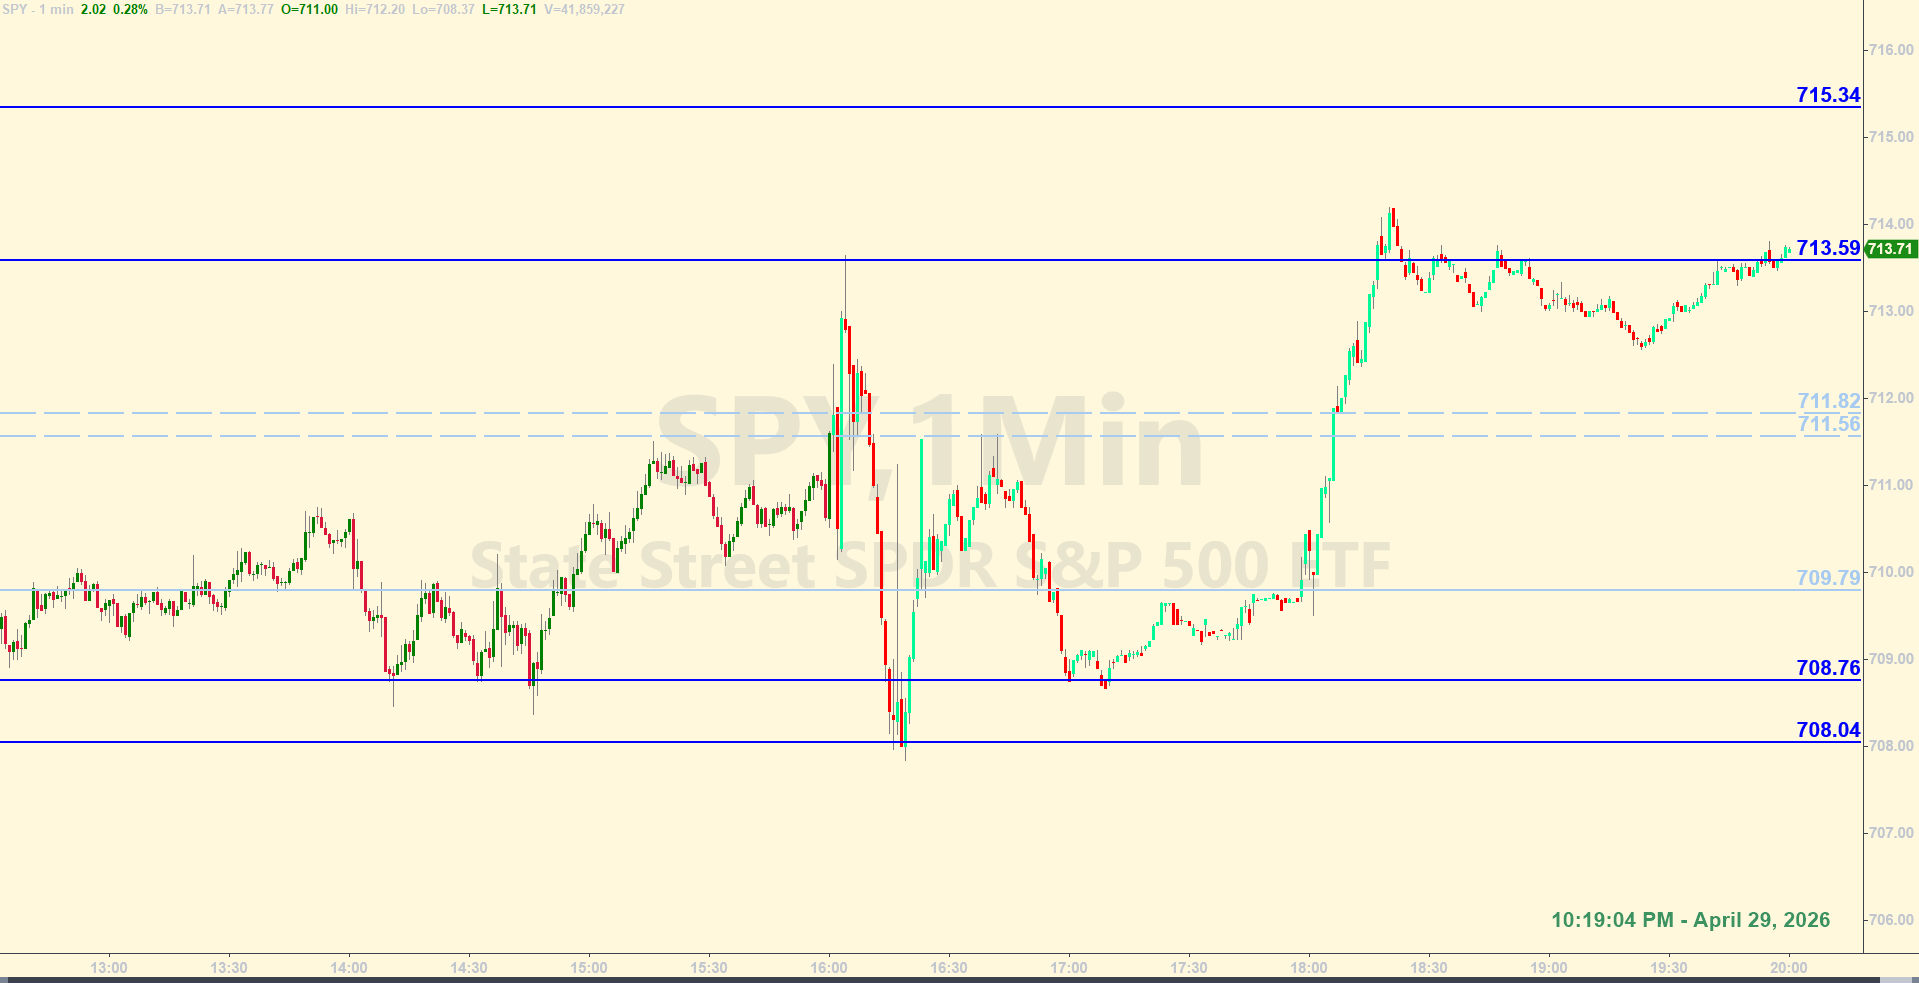
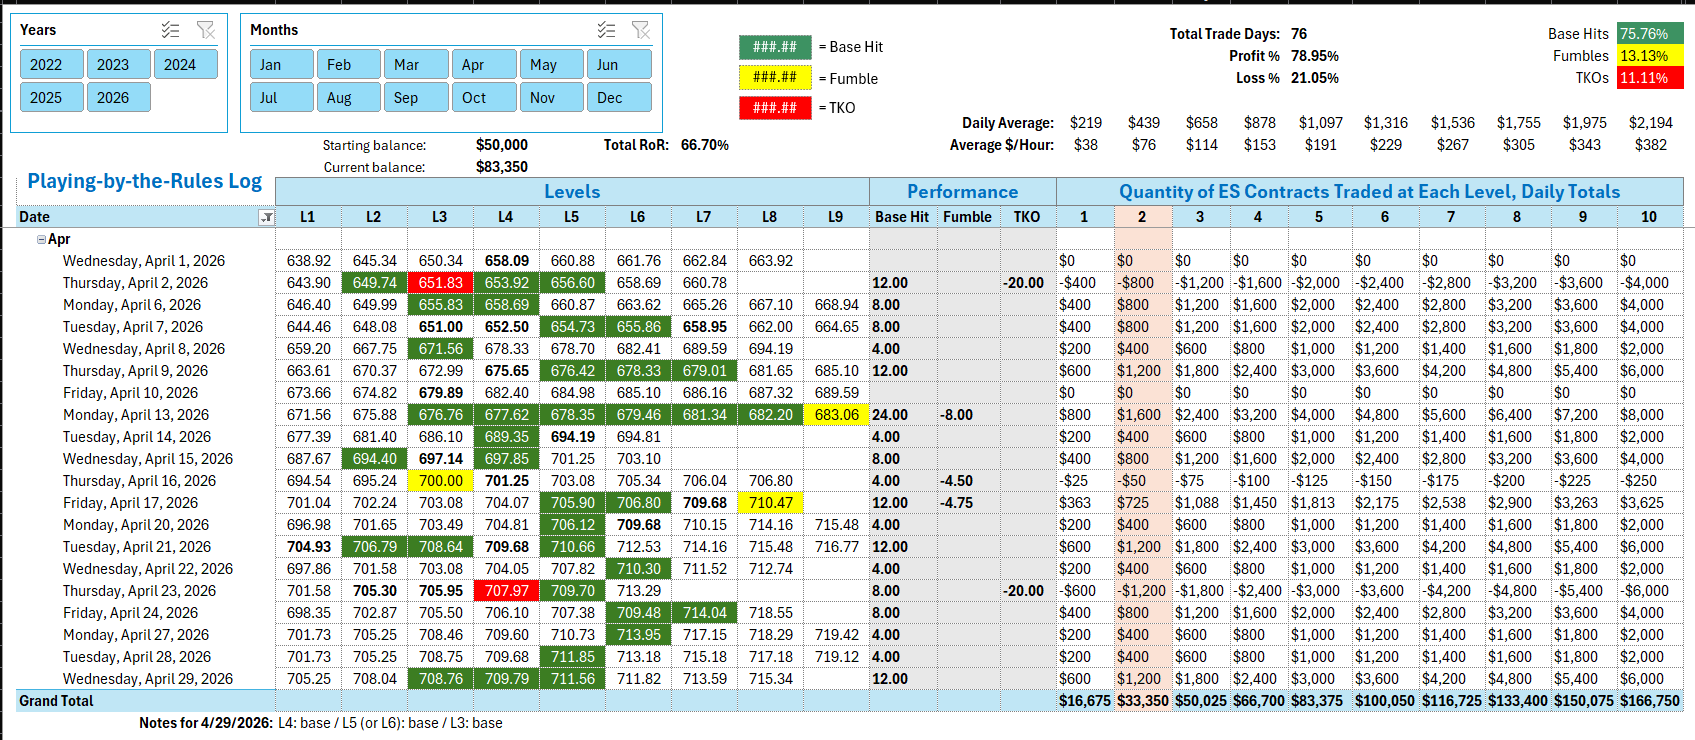
See notes at the bottom of the Tracking Log below to see how the levels worked for today. The data you see in the Log below represents all of 2026 to-date. The rate of return and other metrics assume a starting balance of $50,000 on January 2, 2026, and two (2) ES contracts traded at each level each day, following all the rules of the Ticks & Trades strategy.
Click anywhere on the Log to enlarge the image.
Tracking log to-date for 2026: