
SPY Levels & Game Plan
Tuesday, November 4, 2025
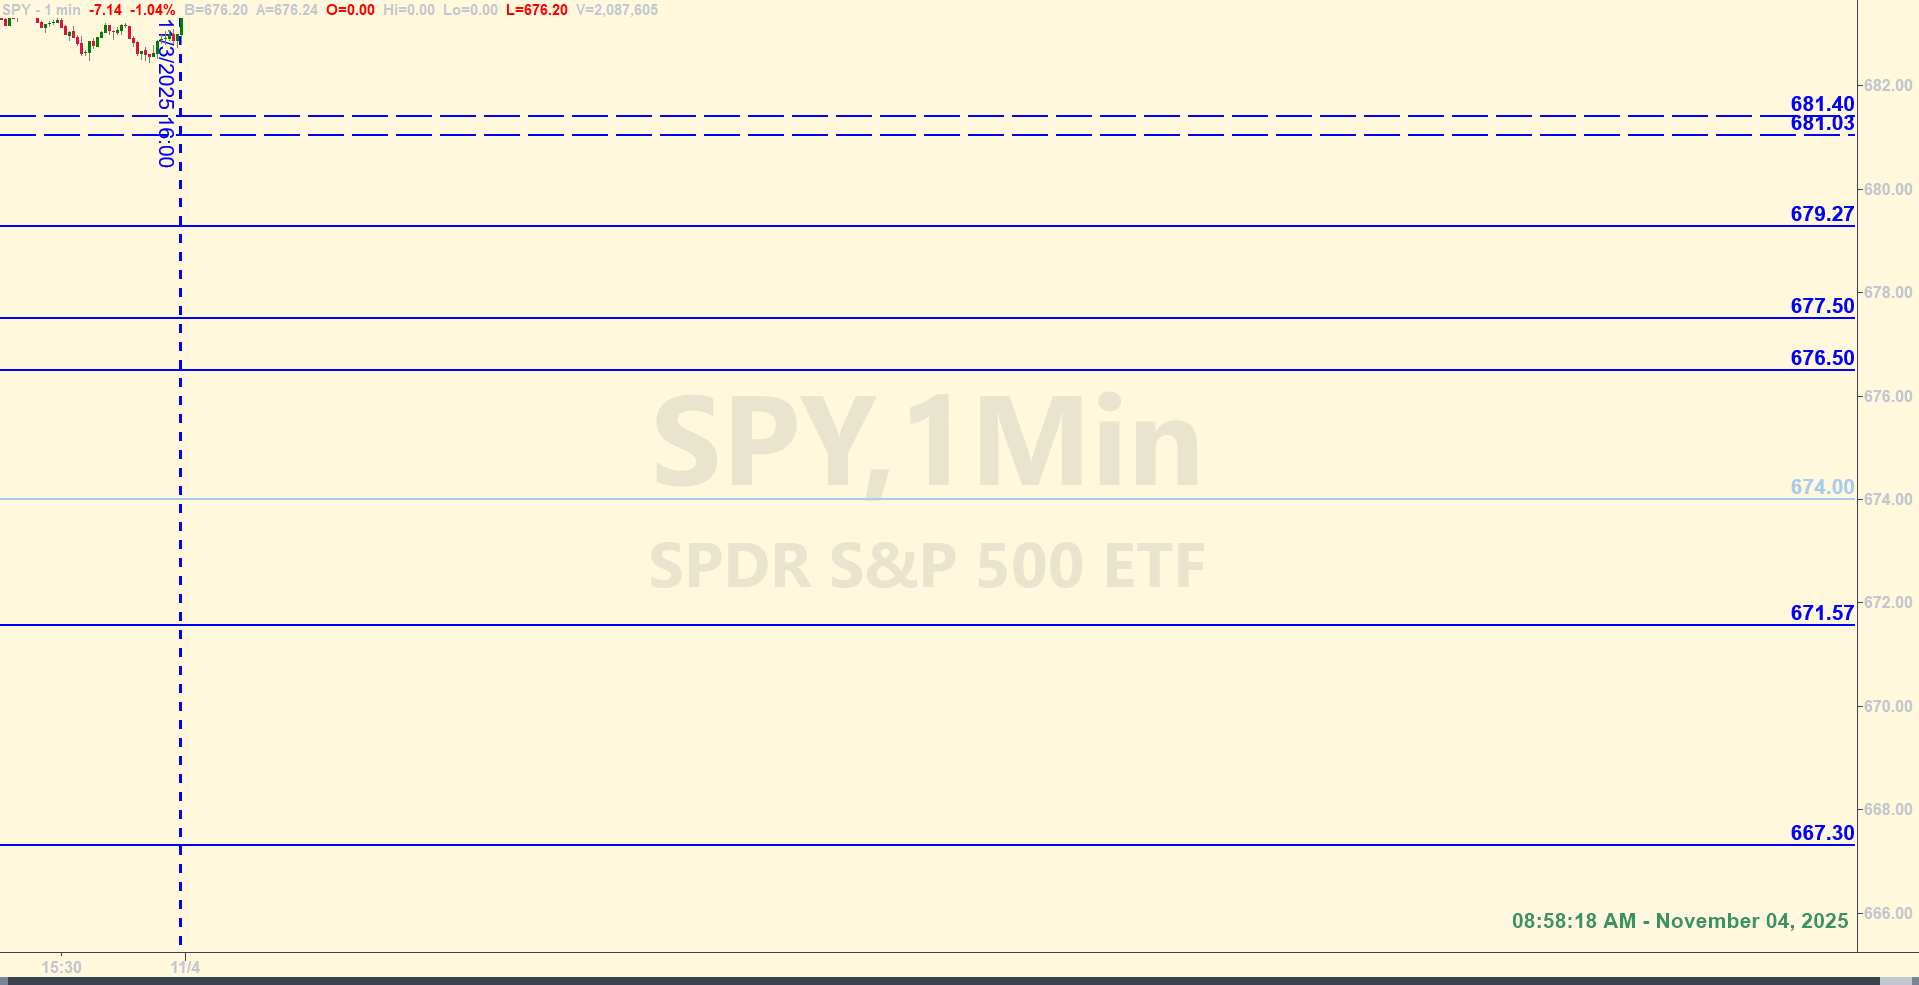
8:58 AM – In yesterday’s Game Plan, we said that there was pressure on both sides of the tape. Overall, the day was down, but the bulls tried to stage a recovery for most of the session after the morning drop. So, there was indeed pressure on both sides. This morning, we have a clue that the bears are showing follow-through. They have managed to get price down to test 674. Remember how we said last week that it would not be surprising if they came back down to test the breakout area around 674 in the near future? Well, they did that in the premarket session this morning very cleanly. Bounced off of 674 at around 5:00 AM Eastern.
Price has recovered a bit in the last few hours, but they are still poised to gap down a not insignificant amount of points this morning. When we zoom out and look at the big picture, the first thing that jumps out to me is that price is retracing the move from the Oct. 14 low to the high on Oct. 29. Dipping below 674 this morning in the premarket session put price closer to the 50% retracement area. SPY 674 is the axis level for today. The bulls need to defend it if they want price to stay above and maybe climb out of this pullback. Getting below and closing candles of significance below 674 is not good for the bulls.
Zooming farther out on the weekly chart we see the doji candle from last week possibly playing out the way those kinds of patterns usually do. We already talked about that being a signal of a possible trend change. At this point, price would need to get all the way above last week’s high – which is the current all-time high of around 689.70 – and get a weekly close above that for the longer-term reversal signal to come off the table. So, that’s kind of a long way off from where price is now. With that in mind, the bears seem to be gearing up for something. If they can get price below 674, bearish momentum can pick up.
The axis level at 674 is therefore a reference level. It may be worth trading against if price comes into it the right way and there are other clues on the charts that validate it’s tradability. But be careful with it. Price could bounce there or they could slice right through it and go lower. That is the thing about axis levels – they’re kind of the fulcrum or pivot point that often determines the next bigger move in the market – at least for the day in question.
Other than that important place at 674, the other levels are designed for base hits. If price does get a lift and the bulls are able to get price to the zone up at 681.03 to 681.40, that could open the door to higher prices and make this whole thing we’re looking at now nothing more than a fake out by the bulls. But at face value, the bears seem to have the upper hand currently. There could be increased volatility today. Be aware of your surroundings and trade well today.
After the closing bell...
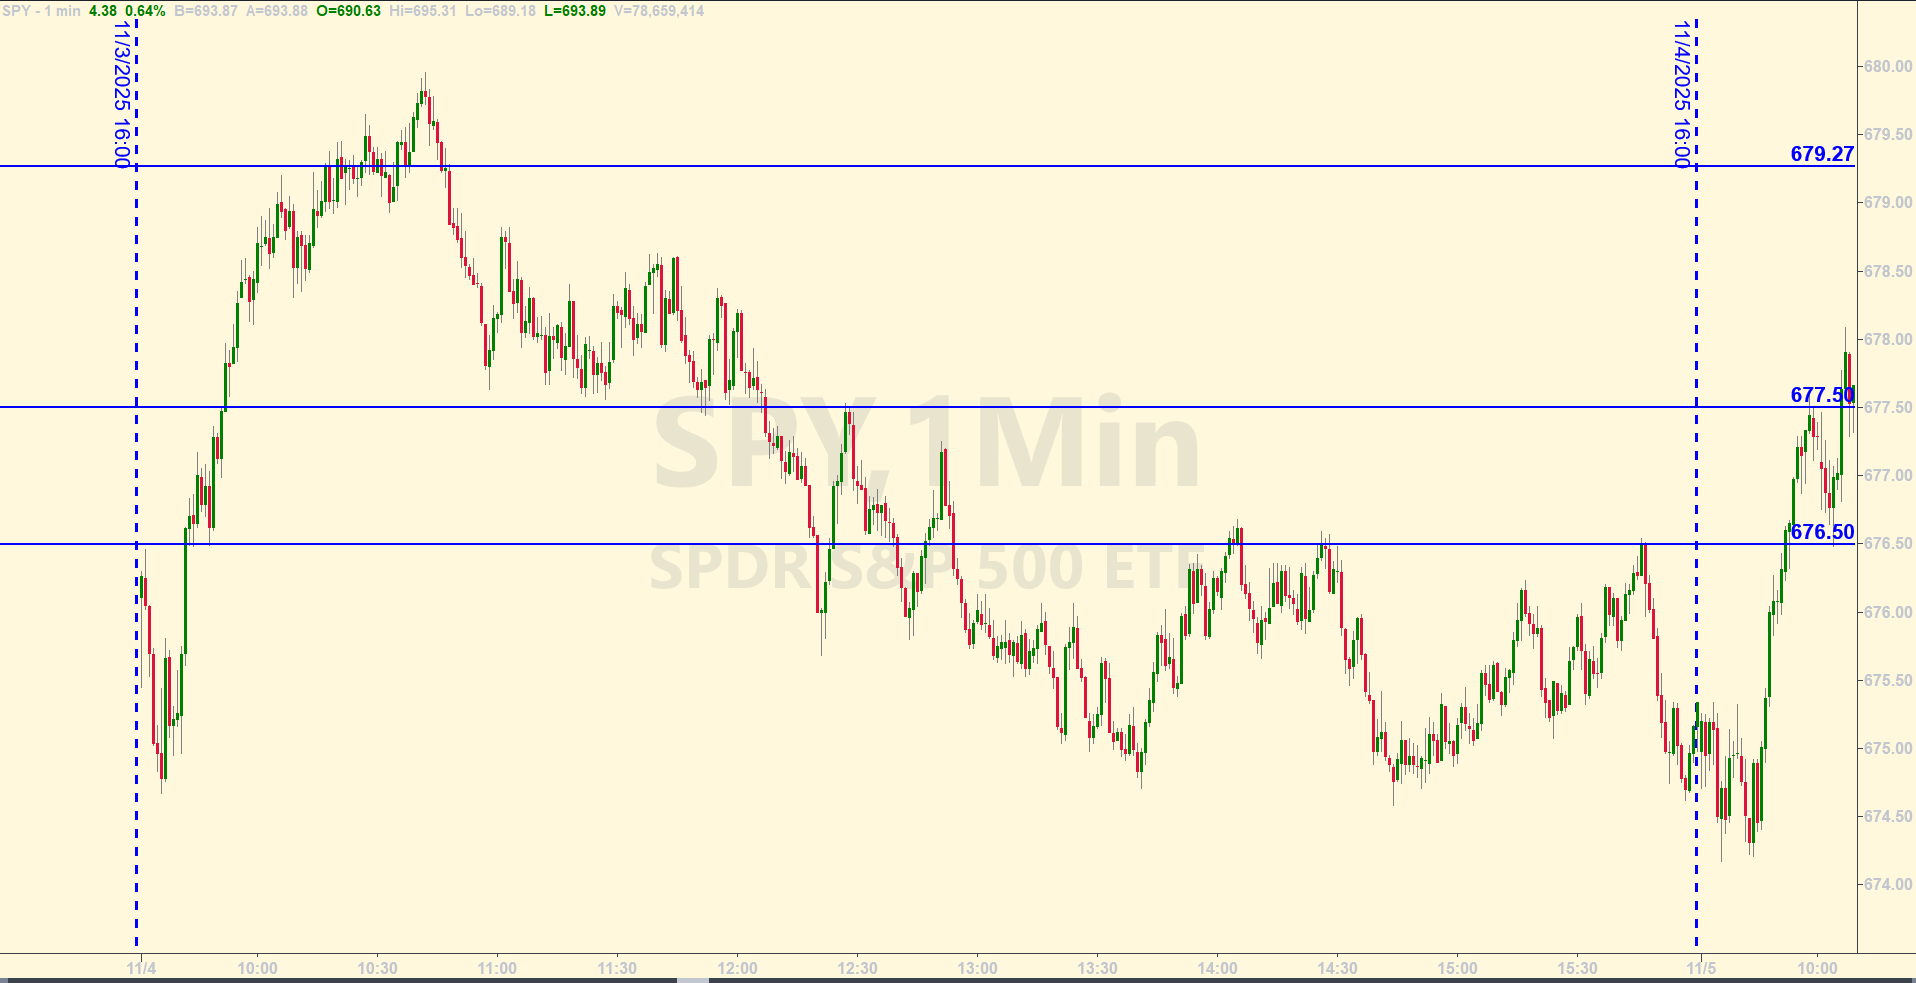
Trading by the Ticks & Trades Rules, here is where you would have landed for the day:
Base hit 676.50 on the LONG side as price bounced off the level on the retest at 9:48 AM. No counter-trend trade at 677.50 because of a Near Miss. Same with 679.27 and the Recycle Trade on the long side back down at 677.50 There were reactions eventually at those levels and more risk tolerant trader could have waited it out and pulled points on those other trades, but the conservative approach was to stick to the Base Hit approach and take only the most probable trades.
Per the rules, one official Base Hit trade for the day for a total of 4 ES points.
Tracking Log to-date for 2025:
